| Gold
Manipulation Intraday Charts
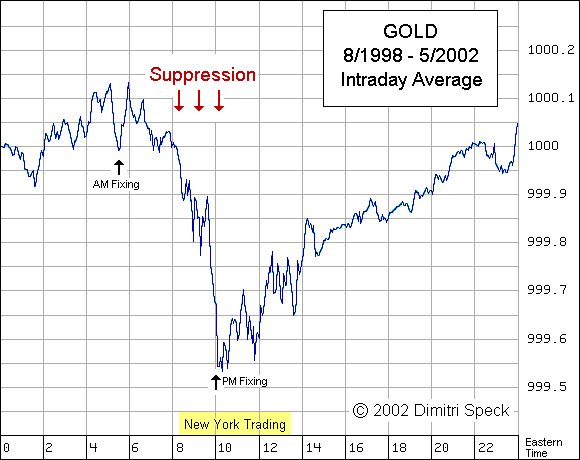
Gold market observers in Europe joke about it by saying: 'Good Morning America!' or 'You can set your watch by it'. What happens when New York wakes up? Generally, the price of gold falls. This intraday price pattern is the result of a price manipulation that takes place in America. That is why the price so often falls when New York trading starts. Many market participants are now aware of this price pattern. They can see it directly from the quotes or from intraday-charts. Kitco (www.kitco.com) offers such intraday-charts, including historical ones. But these are only isolated examples. If we take many examples over a lengthy period and then build an average, we can generalize such individual cases. To do so, we take minutely quoted FOREX data over the last five years from Disk Trading ( http://disktrading.is99.com ). From them we compute the average intraday price change. The following chart thus depicts the average intraday trend in the gold price over the last few years.
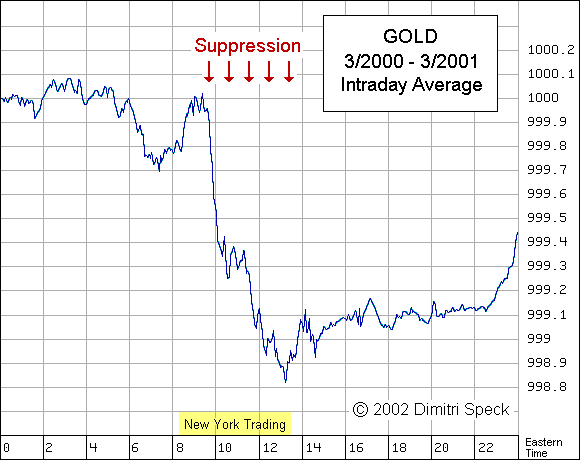
So Figure 1 depicts the average intraday course of the gold price over the last five years. The horizontal scale shows the time (Eastern Time). The vertical scale shows the average price-level (basis=1000). Averaging over many days makes the moves appear small in extent. Figure 1 confirms the impression of so many gold market observers: The price falls when New York opens. Most of this downward move takes place in the first two American trading hours. So the gold price suppression is organized in America. The frequent fall in the gold price at the beginning of trading is intended to create the impression of an ongoing weak market. The first figure spans a period of nearly five years. During this time we had periods with rising prices and periods with falling prices. We will now examine these different periods. We will first look at a phase of falling prices. The gold price fell from March 2000 to March 2001. The gold price suppression was thus very successful during this period. Figure 2 depicts the intraday price course during this period of falling gold prices.
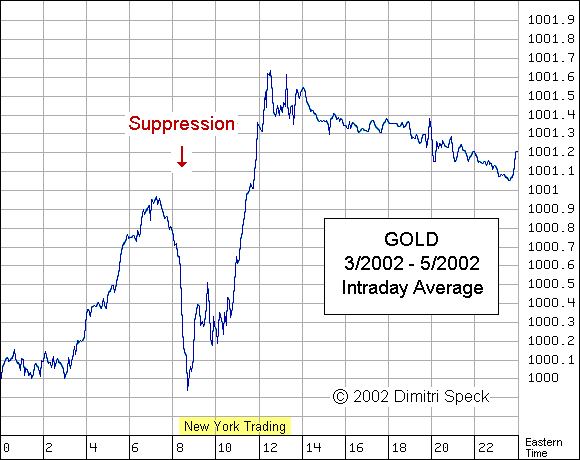
During this period, too, the price of gold fell in the first two trading hours. But the price continued to decline, in contrast to Chart 1, over the entire New York trading session. This indicates a completely successful manipulation. The third Chart depicts the current situation with a rising gold price. The intraday average also shows a rising gold price.
Figure 3 displays major differences as compared with Figure 2. Although the price still falls in the beginning, this fall occurs more than one hour earlier and is steeper. In addition, the price rises earlier on, i.e. during European trading hours. The main difference, however, lies in the fact that, currently, the price then rises sharply even during New York trading session. The closing price in New York is even higher than the opening price. The manipulation is now merely discernible as a brief, but sharp drop within the intraday chart. Figure 3 provides impressive evidence of the problems involved in suppressing the gold price at present. The average intraday trend in all of the three charts clearly reveals the suppression at the beginning of the American trading session. A glance at the entire five-year time frame in Chart 1 shows that the sharpest fall in prices occurs at 10 o'clock Eastern Time. This is the moment of the PM fixing in London. Obviously the aim is to make this important price appear depressed. During the phase of successful manipulation the intraday low appeared at New York close (Figure 2). In the last months it appeared at New York open (Figure 3). Up to now, one could only assume that the gold price was being suppressed at the London AM fixing (at 5:30), too. Chart 1 shows that the price temporarily drops slightly at the AM fixing, too. This drop creates the visual impression of a lower price there, too. But the fall in prices at the AM fixing is much smaller than that at the PM fixing. Harry Clawar was thus able to verify the gold price suppression in a direct manner via a statistical comparison of the price difference between the AM fixing and the PM fixing ( www.gold-eagle.com/research/clawarndx.html ). Extension of his method demonstrated that the price of gold has been manipulated since August 5, 1993 ( www.gold-eagle.com/editorials_01/speck022301.html ). The gold price had previously risen by about $ 80 in summer 1993. Then the FED and the Treasury decided to suppress the gold price in order to benefit the banking system, which would otherwise have suffered huge losses as a result of short positions. A further objective was to defend the US dollar as a reserve currency within the central banking system. Presumably, the gold price manipulation had a bearing on exchange rates, interest rates, indebtedness, money flows, the trade deficit, artificial wealth and the stock market bubble. However, these effects are almost impossible to prove, they are not precise and they turn up with a time lag, which makes the gold-price interventions appear to have commenced later than August 5, 1993. Gibson's paradox, for instance, shows an anomaly since about 1995 ( www.goldensextant.com/commentary18.html#anchor196905 ). The intraday trend, on the other hand, is highly precise with its daily statistical breakpoints. Furthermore, it is directly dependent on the price manipulation pattern. The intraday-charts verify Clawar's method based
on the price difference between the AM fixing and the PM fixing. They show
details of the manipulation procedure and confirm this secret intervention.
In addition, recent changes in the intraday pattern indicate the gold price
suppression is coming to an end.
Dimitri Speck
June 28, 2002
http://www.gold-eagle.com/editorials_02/speck062802.html |


